

Guar Gum Price Index 2026: Latest Trends, Data and Market Insights
The global Guar Gum Price Index in Q1 2026 reflected a moderately firm trend, supported by steady demand from food processing, oil drilling, and pharmaceutical sectors. The Guar Gum Price Chart indicated a gradual upward movement during the quarter, especially in European markets. Spain recorded the highest price at USD 1901/MT, closely followed by the Netherlands at USD 1899/MT, while China remained the lowest at USD 1320/MT. Compared to Q4 2025, prices rose by approximately 3%–5%, highlighting stable consumption and limited supply pressures.
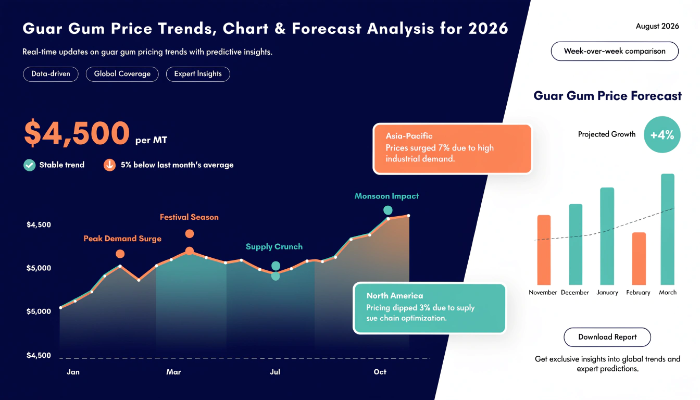
Guar Gum Price Chart Analysis
The Guar Gum Price Chart for Q1 2026 demonstrates a steady increase across most regions. Prices in January remained stable with slight fluctuations due to post-harvest supply adjustments. February witnessed moderate growth driven by improved export demand and consistent industrial usage.
By March, prices reached peak levels in Europe, with Spain at USD 1901/MT and the Netherlands at USD 1899/MT. China recorded the lowest price at USD 1320/MT due to ample domestic supply. Compared to Q4 2025, the chart reflects a recovery trend, with prices showing gradual improvement rather than sharp spikes, ensuring predictable movement for buyers.
Guar Gum Price Trend Q1 2026: Global Market Overview
The guar gum price trend in Q1 2026 remained stable to slightly bullish across global markets. Demand from oil and gas drilling, particularly hydraulic fracturing, continued to support consumption. Additionally, the food industry maintained steady usage due to guar gum’s role as a thickening agent.
Supply conditions remained balanced, with India—the largest producer—ensuring adequate availability. Favorable weather conditions during cultivation also supported production levels, limiting supply shortages and stabilizing price movements.
Regional Price Analysis
North America
North America experienced stable pricing, with the USA at USD 1473/MT and Canada at USD 1559/MT. Demand from oil drilling and food processing sectors remained consistent, supporting moderate price growth.
Europe
Europe recorded the highest price levels globally. Spain (USD 1901/MT) and the Netherlands (USD 1899/MT) saw strong demand from food, pharmaceutical, and industrial sectors. Higher import costs and logistics expenses contributed to elevated prices.
Asia-Pacific
Asia-Pacific showed relatively lower pricing, with China at USD 1320/MT. The region benefited from sufficient supply and competitive production costs. India’s export activity also influenced regional pricing stability.
Regional Price Snapshot Table
- USA: USD 1473/MT
- China: USD 1320/MT
- Netherlands: USD 1899/MT
- Spain: USD 1901/MT
- Canada: USD 1559/MT
The Q1 2026 pricing snapshot highlights clear regional differences. Europe led with the highest prices due to strong demand and higher import costs. North America maintained moderate pricing supported by industrial demand, while Asia-Pacific remained the most cost-competitive region. Overall, the global pricing structure reflects balanced supply and consistent consumption patterns.
Key Market Drivers
- Strong demand from oil and gas drilling activities
- Stable consumption in food and beverage industry
- Consistent pharmaceutical sector usage
- Adequate supply from major producing regions like India
- Favorable agricultural conditions supporting production
- Rising logistics and transportation costs in Europe
Guar Gum Price Forecast 2026
The Guar Gum Price Forecast for 2026 suggests a stable to moderately increasing trend. Demand from the oil and gas sector is expected to remain a key growth driver, especially with ongoing exploration activities.
Food and pharmaceutical industries will continue to support steady consumption levels. Prices may see slight increases in Europe and North America due to higher operational costs, while Asia-Pacific is likely to remain relatively stable. Overall, the outlook indicates gradual growth without significant volatility.
Guar Gum Price Index & Historical Comparison
The Guar Gum Price Index provides a reliable benchmark for tracking price movements over time. In Q1 2026, the index showed a moderate increase compared to Q4 2025, reflecting improved demand conditions.
Historically, prices experienced fluctuations due to variations in agricultural output and export demand. The guar gum price history chart indicates that current levels are approaching previous stable ranges, suggesting a balanced phase in the pricing cycle.
Impact on Related Markets
Fluctuations in guar gum prices directly impact several downstream industries. The oil and gas sector is highly sensitive, as guar gum is widely used in hydraulic fracturing fluids. Higher prices can increase operational costs for drilling activities.
The food and beverage industry may also experience cost adjustments, particularly in processed foods where guar gum acts as a stabilizer. Additionally, pharmaceutical formulations relying on guar gum could see minor pricing impacts.
FAQs About Guar Gum Pricing Insights & Trend Analysis:
What is the Guar Gum Price Index?
The Guar Gum Price Index measures price changes over time and helps businesses track trends for procurement and planning decisions.
What does the Guar Gum Price Chart show for Q1 2026?
The Guar Gum Price Chart indicates a gradual upward trend, with Europe recording the highest prices and Asia-Pacific maintaining lower levels due to strong supply.
What is the Guar Gum price forecast 2026?
The guar gum price forecast 2026 suggests stable to moderately rising prices, driven by demand from oil drilling, food processing, and pharmaceutical sectors.
Conclusion: Strategic Outlook and Future Insights
Guar gum prices in Q1 2026 showed a stable and gradually increasing trend across key regions. Europe led with higher prices, while Asia-Pacific remained competitive due to strong supply. The Guar Gum Price Index reflects a balanced recovery supported by consistent demand.
Looking ahead, prices are expected to remain firm with moderate growth. Demand from oil and gas, food, and pharmaceutical industries will continue to shape pricing trends, ensuring steady market conditions throughout 2026.
Contact Us:
IMARC Group
134 N 4th St., Brooklyn, NY 11249, USA
Email: sales[@]imarcgroup.com
Tel No:(D) +91 120 433 0800
United States: +1-201971-6302